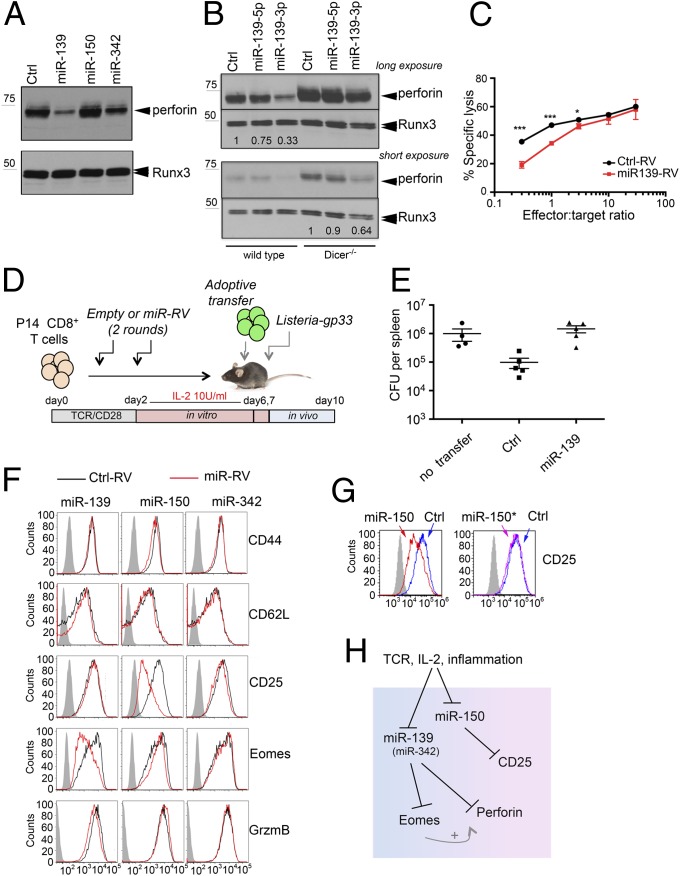
Fig. 5.
Control of effector CTL differentiation by miR-139, -150, and -342. (A) Perforin expression analyzed by Western blot in CTLs transduced with empty retrovirus (RV) (Ctrl) or RV containing the indicated pri-miR and cultured for 6 days in 100 U/mL IL-2. Runx3 is used as a loading control. Results are representative of three experiments. (B) Perforin expression in wild-type and Dicer−/− CTLs transfected with miRNA mimics, either nontargeting (Ctrl) or corresponding to the miR-139-5p or -3p strand. (C) Cytotoxicity assay performed using day 6 effector CTLs, either mock-transduced (Ctrl-RV) or transduced with miR-139-RV. Each point represents the average ± SD of three samples. Results are representative of two experiments, one with three mice per condition and the other with two mice. *P < 0.05; ***P < 0.001. (D) Schematic representation of the Listeria protection assay, with transfer of in vitro generated memory-like CTLs transduced with empty (Ctrl) or miR-139–expressing RV. (E) Quantification of Listeria CFUs per spleen 3 days after infection. “No transfer,” mice that did not receive any cell transfer. Each dot represents a single mouse. Results are representative of three independent experiments, each with four to six mice per group. (Mean +/− standard error.) (F) Activated CD8+ T cells were transduced as in A, and expression of the indicated markers was analyzed on day 6. The results are representative of at least three experiments. (G) CD25 expression in CTLs from P14 transgenic mice transfected with miR-150 or miR-150* miRNA mimics. (H) Schematic model of how TCR, IL-2, and inflammatory signals modulate the expression of perforin, Eomes, and CD25 through miR-139, -150, and -342 in CTLs.

