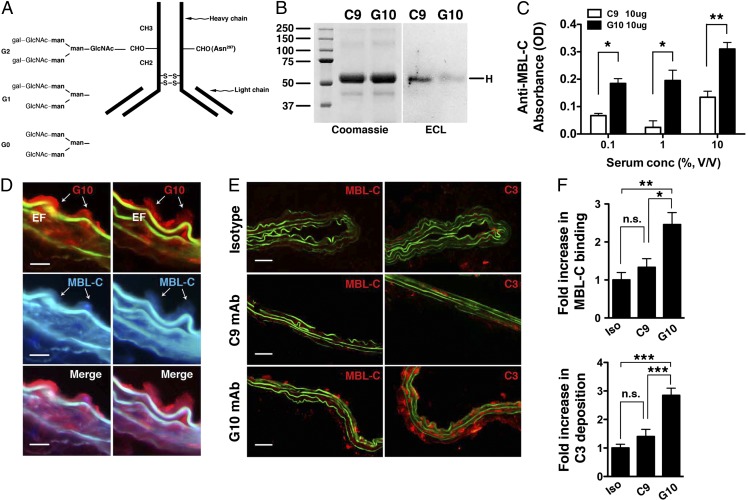
Fig. 4.
Activity of anti-fibrinogen mAb glycovariants in complement activation. (A) Schematic depiction of different glycan chains linked to asparagine 297 (Asn297) of the CH2 domain of IgG heavy chain. Gal, galactose; GLcNAc, N-acetyl glucosamine; man, mannose. (B) Blotting with Erythrina cristagalli lectin (ECL) detects the level of terminal galactosylation. Coomassie blue-stained gel is shown for protein loading control. (C) Mouse serum (as a source of MBL, at the indicated percentage of dilution) was incubated with plate-bound C9 or G10 mAb (10 μg/mL); MBL-C binding to the mAb was detected with an anti–MBL-C antibody. Data shown represent mean ± SEM of triplicate values derived from three independent experiments. *P < 0.01, **P < 0.001. (D) Aortas from elastase-perfused, G10-reconstituted μMT mice were probed for MBL-C (blue) and G10 (red) deposition. Representative sections showing colocalization of MBL-C and fibrinogen (detected with G10 mAb). Elastic fibers (EF) autofluoresce in green and blue spectra. (Scale bar, 15 μm.) (E) μMT mice were perfused with elastase and immediately injected with 250 μg of isotype control or the indicated mAb. Aortas were harvested at 30 min and examined for MBL-C (red) or C3 (red) deposition as evidence of complement activation. Representative photomicrographs are shown. (Scale bar, 50 μm.) (F) Quantitative analysis of MBL-C binding and C3 deposition in abdominal aortas 30 min after elastase perfusion and mAb transfer. n = 3 aortas per treatment, six to nine sections per aorta. Values represent fold increase in integrated OD (IntDen) ± SEM compared with isotype (iso) control (set at 1). *P < 0.05, **P < 0.01, ***P < 0.002, NS, not significant.

