Fig. 2.
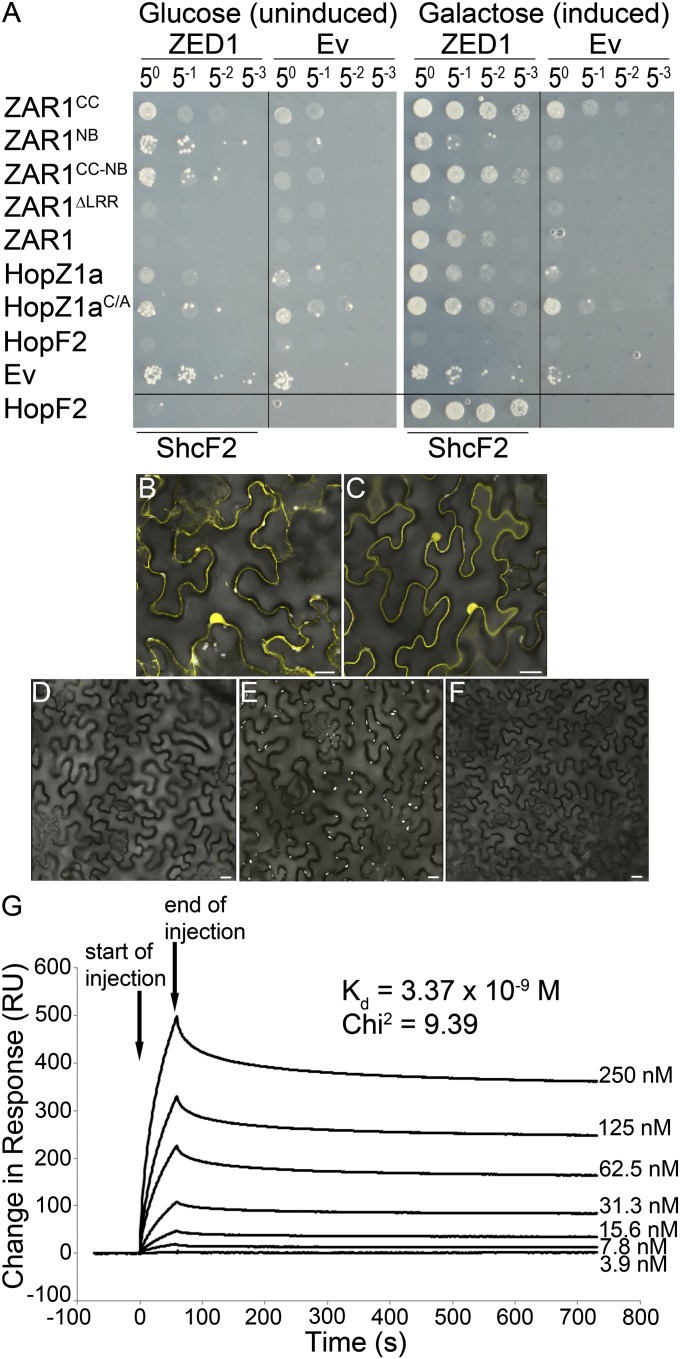
ZED1 interacts with HopZ1a and ZAR1. (A) ZED1 was constructed as an activation-domain (AD) fusion protein and was tested for its interaction with DNA-binding domain (BD)-fused ZAR1, HopZ1a, the catalytic mutant HopZ1aC/A, and HopF2PtoDC3000 (hereafter HopF2) in the LexA yeast two-hybrid system. HopF2 and ShcF2PtoDC3000 were used as positive controls because they are known to strongly interact (23). (B–F) BiFC of HopZ1aC/A, ZED1, and ZAR1. Agrobacterium carrying HopZ1aC/A::nYFP, ZAR1::nYFP, ZED1::cYFP, and MLO2∆1–280::nYFP or cYFP were mixed in equivalent optical densities and pressure-infiltrated into the leaves of N. benthamiana. HopZ1aC/A was used because HopZ1a causes an HR in N. benthamiana. Protein expression was induced by using 30 µM dexamethasone. Leaf sections were imaged by using a Leica SP3 confocal scanning microscope 24–48 h after induction. (Scale bar: 20 µm.) Coexpressed pairs are as follows. (B) ZAR1::nYFP and ZED1::cYFP. (C) HopZ1aC/A::nYFP and ZED1-cYFP. (D) MLO2∆1–280::nYFP and ZED1::cYFP. (E) ZAR1::nYFP and MLO2∆1–280::cYFP. (F) HopZ1aC/A::nYFP and MLO2∆1–280::cYFP. (G) Surface plasmon resonance analyses of the HopZ1a/ZED1 interaction. His-HopZ1a was immobilized to the surface of a Biacore CM5 sensor chip, and His-ZED1 was flowed over the bound surface at increasing protein concentration to calculate a dissociation constant (Kd). ZED1 displays very high-binding affinity (Kd = 3–5 nM) to His-HopZ1a (χ2 of 9.39). Arrows indicate the start and end of His-ZED1 injection.

