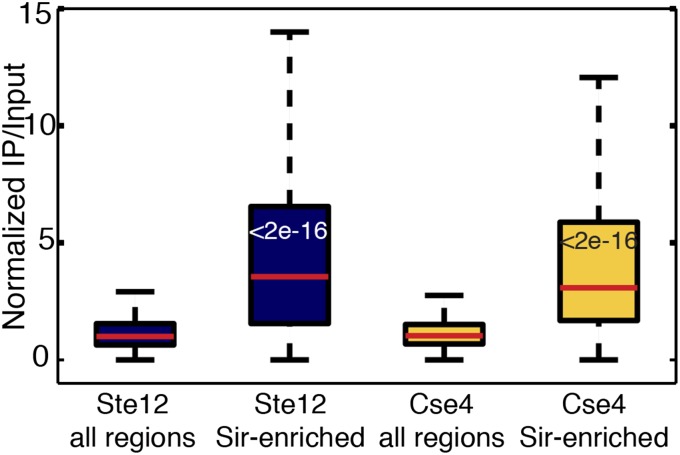
Fig. 2.
Sir-enriched euchromatic loci are hyper-ChIPable. Boxplots of ChIP-Seq levels for the transcription factor Ste12 and the centromeric Cse4 protein, comparing the genome-wide distribution versus the 238 Sir-enriched loci. The top of each box indicates the 75th percentile, the bottom the 25th percentile, and the thick bar inside the box is the median. The whiskers extend out to the most extreme data point that is at most 1.5 times the interquartile range from the box. Wilcoxon–Mann–Whitney P values comparing the genome-wide and Sir-enriched distributions are shown in the Sir-enriched boxes.

