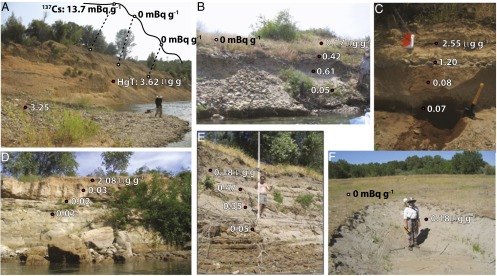
Fig. 2.

Characteristic sampling sites and geochemical data arranged in downstream order. Red circles indicate approximate HgT sampling locations within the chemostratigraphy. White circles indicate approximate 137Cs sample locations from surface sediments. (A, C, and D) Intact mining sediment from the original mining period. (B, E, and F) Upper layers of reworked mining sediment mixed with background (nonmining) sediment. F is adapted from Singer et al. (25). E and F represent lowland sites downstream of the Yuba Fan along the Feather River (Fig. 1A).
