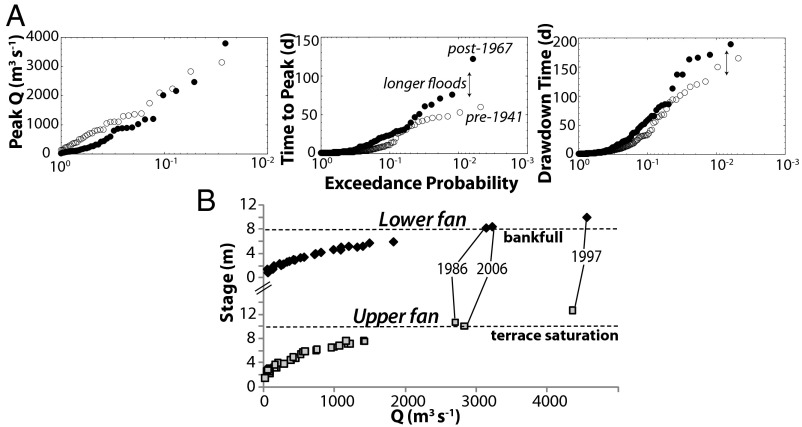
Fig. 3.
Flood frequency and stage-discharge relationships for the upper and lower Yuba River Fan. (A) Frequency of historical hydrograph characteristics [peak discharge (Q), rising limb duration, and falling limb duration] shows differences before (1903–1940) and after (1968–2010) construction of upstream dams. (B) Stage-discharge curves for 1968–2010 highlight thresholds for terrace saturation (Upper fan) and bankfull discharge (Lower fan).

