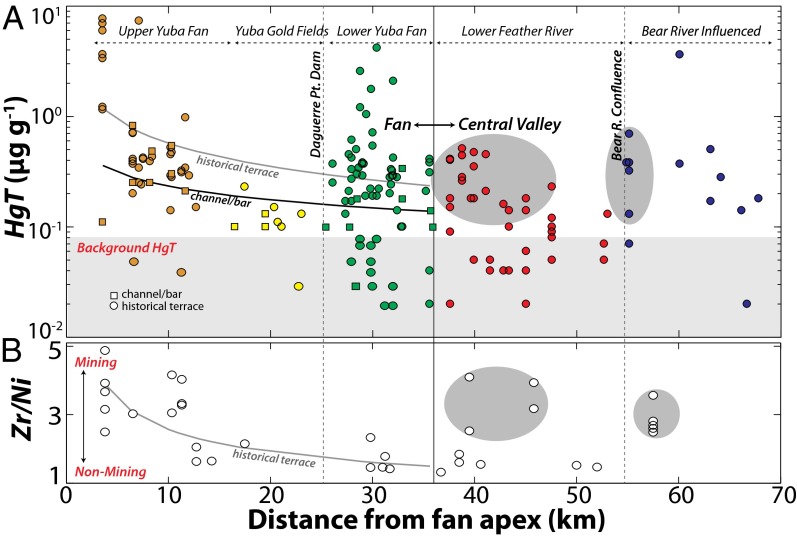
Fig. 5.
Downstream patterns of geochemistry within and beyond the Yuba Fan. Measured HgT (A) and Zr/Ni (B) in sediments (Dataset S1). Power relationships fit to all HgT (including all stratigraphic positions from each historical terrace) and Zr/Ni data within the Yuba Fan are given in Fig. S1. Colors in A refer to geographical domains listed at the top of the figure. Shaded ovals indicate elevated geochemical concentrations downstream of the margins of anthropogenic fans.

