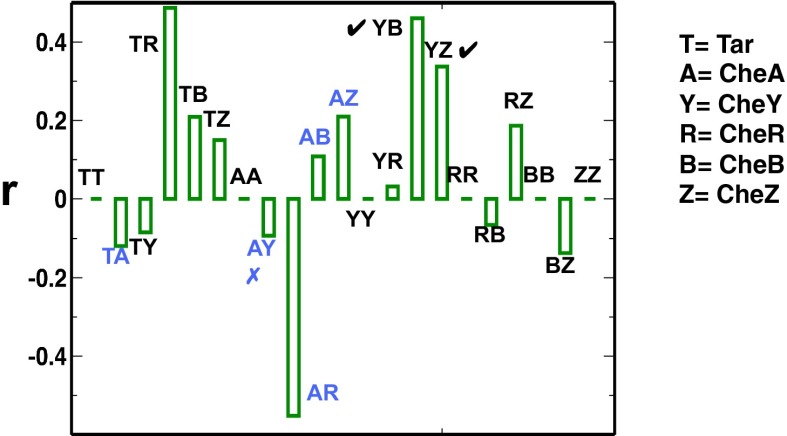
Fig. 2.
Observed chemotactic response imposes pairwise correlations between proteins. We constrained mean values of τ, τ2, s, p, and p2 to the respective values measured in experiments, that is,  ,
,  ,
,  ,
,  , and
, and  , for estimating distributions of protein abundances using our MaxEnt approach. The pairwise Pearson correlation coefficients are calculated for six chemotactic proteins using the MaxEnt distributions (rMaxEnt) for the MBL model and the a priori uniform distribution (runi). We show the difference,
  for different protein pairs. When cross-correlations between protein pairs are considered, runi ≈ 0. Because, by definition, rMaxEnt = runi =1, r = 0 when correlations between the same protein pairs (or variances) are considered. The protein pairs encoded by genes in the same and different operons are shown in black and blue, respectively. The agreement and disagreement with experiments assaying protein expression in single cells and in in vitro cloned gene pairs are shown with a tick and a cross symbol, respectively.

