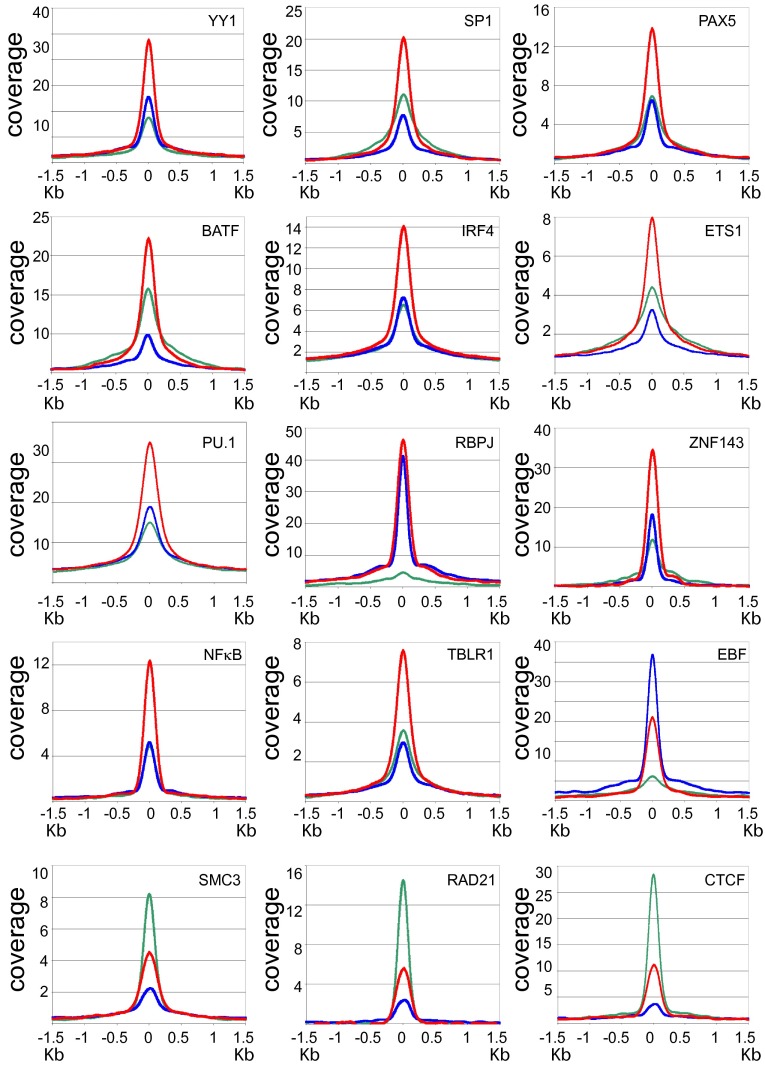
Fig. 2.
Anchor plots of cell TF coverages at LP, LP/E2, and E2 sites. The upper 12 panels show higher cell TF coverage at LP/E2 (red line) than at LP (green line), or E2 (blue line) sites (±1.5 kb). EBF differs in having higher coverage at the E2 site than at LP or the LP/E2 site. The lower three panels show higher cell TF coverage for DNA looping factors SMC3, RAD21, and CTCF at LP sites than at E2 or LP/E2 sites.

