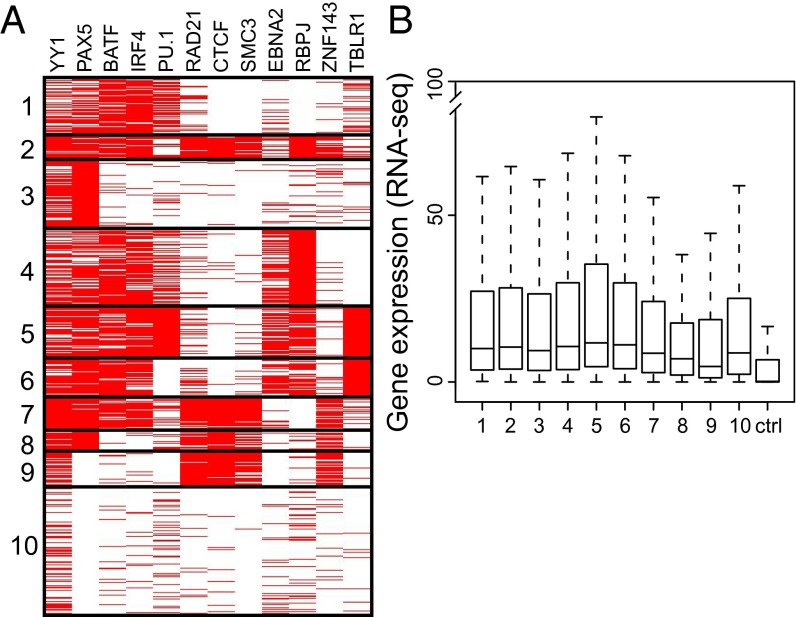
Fig. 4.
LP site-associated cell TFs separated into 10 K-means clusters and gene expression. (A) Cell TFs YY1, PAX5, BATF, IRF4, and PU.1 were prominent components of most clusters, consistent with their 30–59% LP site association. Notably, E2, RBPJ, and TBLR1 clustered separately from looping factors CTCF, SMC3, and RAD21. (B) Box plots of RNA-seq gene expression from LP-affected promoters. All LP-affected genes were more highly expressed than random control genes (P < 2 × 10⁻¹⁶). The box plots indicate the data distribution in percentiles, with the horizontal line being the median. The top of the box represents upper 25% quartile (25% of the data over that value), and the bottom of the box, the lower quartile (25% of the data below that value). The horizontal lines at the ends of the dotted lines are the maximum observed values, excluding the outliers.

