
Figure 4.
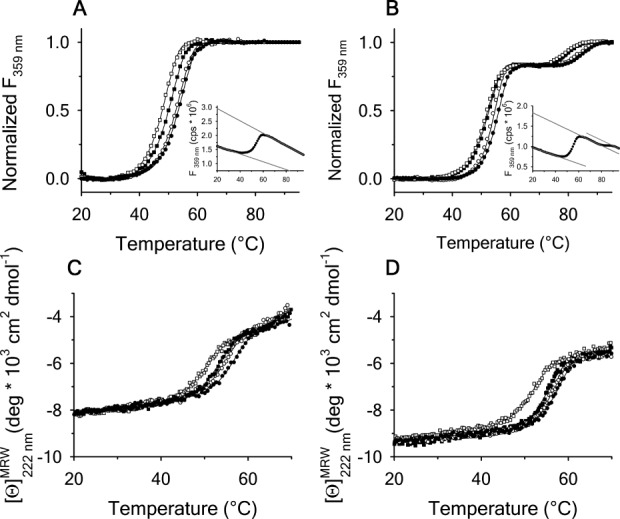
Scan rate dependency of normalized thermal unfolding transitions by fluorescence ( ) of A1-1261 (A) and A1-1238 (B) with excitation
 . Scan rates were
 (black circles),
 (open circles),
 (black squares) and
 for A1-1261 and
 for A1-1238 (both with open squares). Insets show representative thermal scans and corresponding baselines before data normalization. Scan rate dependency of thermal unfolding transitions by CD at
 for A1-1261 (C) and A1-1238 (D). Scan rates were
 (black circles),
 (open circles),
 (black squares), and
 (open squares).