
Figure 1.
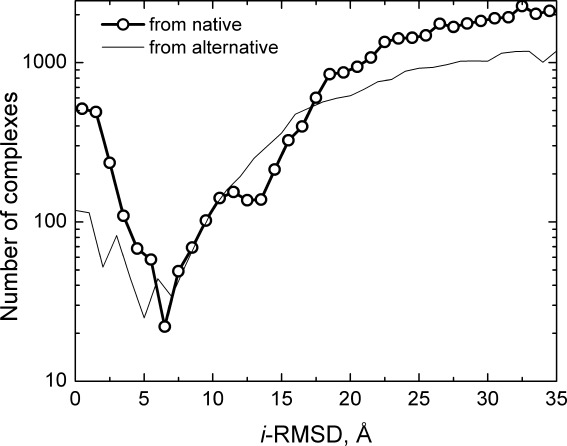
Distribution of protein–protein complexes generated by structural alignment with homologous templates. The i-RMSD is calculated relative to the native X-ray structure of the complex (thick line with circles), as well as to the generated structure with the largest i-RMSD from the native structure (thin line). The distinct minimum in the bimodal native-based distribution separates the main binding mode (smaller i-RMSD values) from the alternative binding modes (larger i-RMSD values). For comparison, the distribution from the alternative, most distant binding mode (the largest i-RMSD from the native structure) shows a similar to the native-based distribution pattern. A greater dispersion of values in this distribution corresponding to small i-RMSDs is likely caused by an overall smaller number of generated complexes (see text), and lower cluster occupancy at the putative alternative binding site, than at the native site.16 The qualitative similarity of the distributions, obtained from the different reference points, indicates similar separation of the binding modes.