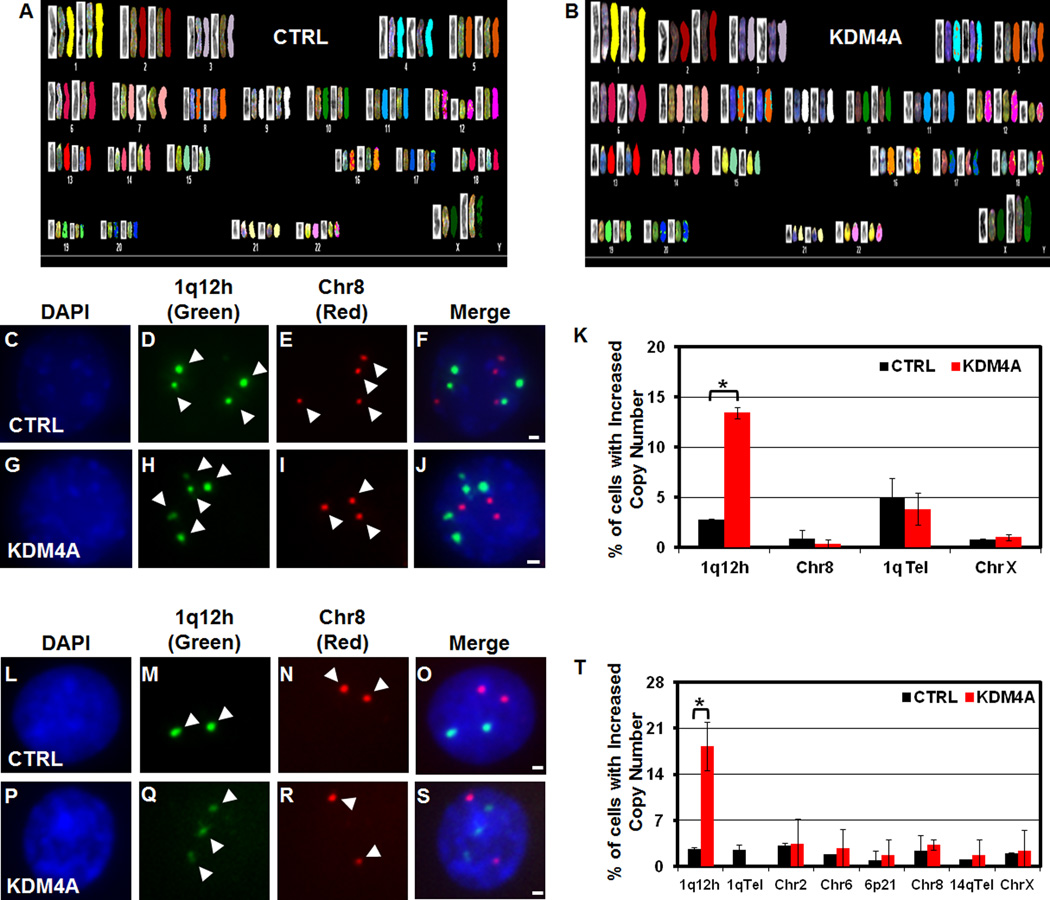
Figure 2. KDM4A overexpression results in 1q12h copy gain.
(A–B) SKY analysis of RPE GFP-CTRL and GFP-KDM4A cells. (C–J) FISH of stable 293T cells overexpressing GFP-CTRL or GFP-KDM4A, respectively: (DAPI- C, G); 1q12h (Green- D, H); Chr 8 centromere (Red- E, I); merged images in F, J. (K) Quantification of FISH experiments in stable 293T GFP-CTRL (Black bars) and GFP-KDM4A cells (Red bars) with the indicated FISH probes. (L–S) FISH of stable RPE cells overexpressing GFP-CTRL or GFP-KDM4A, respectively: (DAPI- L, P); 1q12h (Green- M, Q); Chr 8 (Red- N, R); merged images in O, S. (T) Quantitation of RPE FISH experiments. Arrowheads indicate foci in FISH images. Error bars represent the S.E.M. * indicates significant difference from GFP-CTRL (P<0.05) by two-tailed students t-test. Scale bars represent 2µm. See also Figure S2.

