
Figure 6. Maximal expiratory flow–volume curves, tidal flow–volume loops and minute ventilation for the subset of EIAH subjects (n= 18) split into groups based on the development of expiratory flow limitation during the constant load exercise test.
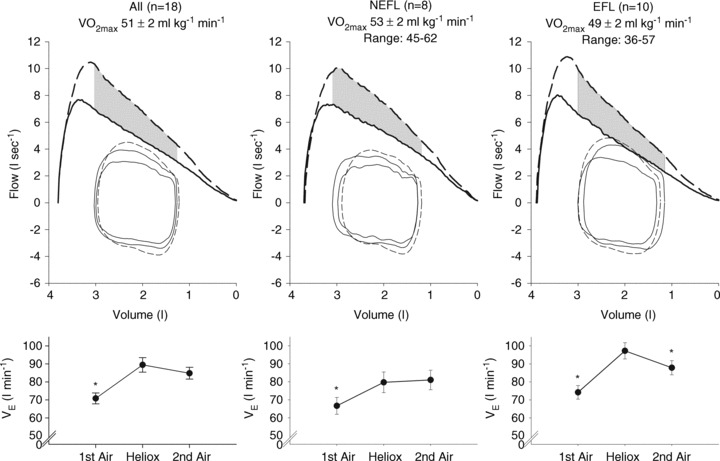
Values are mean averages for each panel's respective number of subjects. Continuous lines represent room air breathing and dashed lines indicate heliox breathing. Grey shaded area in each upper panel represents the increase in ventilatory capacity due to heliox. EFL, expiratory flow limitation; NEFL, no expiratory flow limitation;  , maximal oxygen consumption;
  , expired minute ventilation. *Different from heliox stage, P < 0.05.