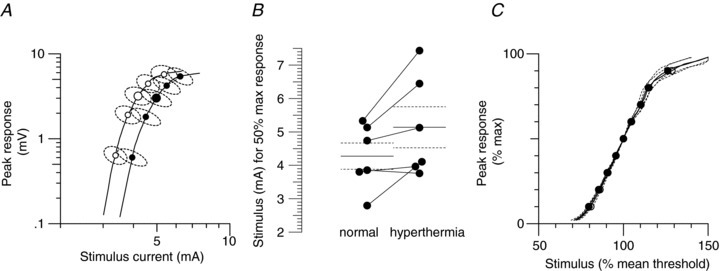
Figure 2. Stimulus–response relationship during hyperthermia.

Group data (n= 6). A, recruitment of CMAP (measured baseline to peak) by gradually increasing stimulus intensity (normal temperature, open circles; hyperthermia, filled circles). B, stimulus required to recruit a half-maximal response at normal and hyperthermic temperatures. The continuous and dashed horizontal lines indicate the mean and standard errors (the mean half-maximal stimulus is also indicated by the large circles around the symbols in A.). C, normalized stimulus–response relationship recorded at normal and hyperthermic temperatures (open and closed circles, respectively). The peak response is normalized to a percentage of maximum and the stimulus is normalized to the stimulus current required for a half-maximal potential, before being averaged.
