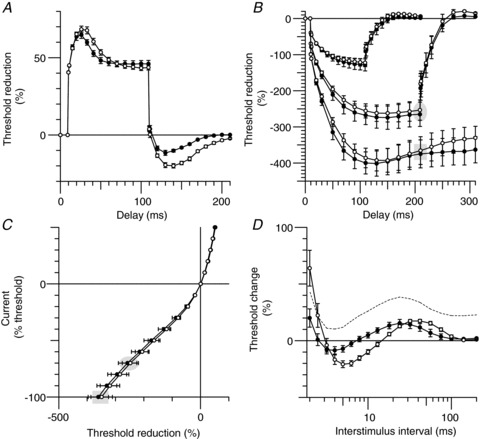
Figure 3. Motor axon excitability during focal hyperthermia.

Group data (n= 6; mean ± SEM). Measurements of axonal excitability were made at normal resting temperature (open circles) and during focal hyperthermia (filled circles). A, threshold electrotonus for a depolarizing conditioning current of +40% of the unconditioned threshold. B, threshold electrotonus for hyperpolarizing conditioning currents of −40, −70 and −100%. C, current–threshold relationship for 200 ms-long conditioning currents from +50% (depolarizing) to −100% (hyperpolarizing) of the control threshold. D, the recovery of excitability following a supramaximal discharge. The dotted line represents the recovery of excitability during hyperthermia when normalized to the unconditioned threshold at ‘normal’ temperature (see Discussion). The corresponding data points in threshold electrotonus (B) and the current–threshold relationship (C) are highlighted by the shaded ellipses and rectangles for hyperpolarization by −70 and −100%, respectively.
