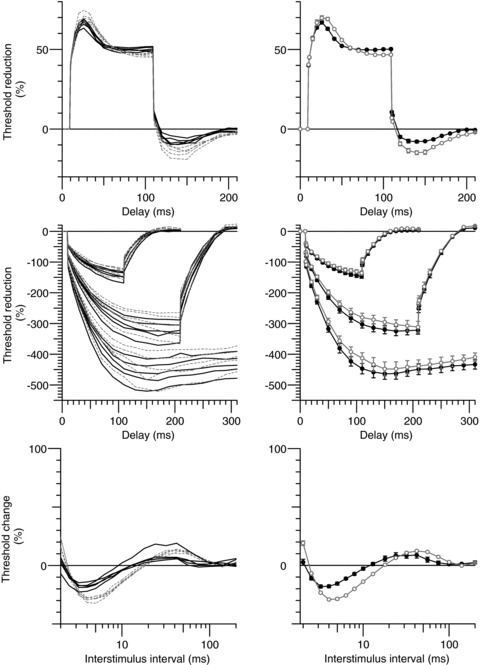
Figure 4. Reproducibility of hyperthermia induced changes.

Left column, repeated measurements of axonal excitability in subject 1 on five separate occasions (normal temperature, dashed lines; hyperthermia, continuous lines). Right column, mean data (normal temperature, open circles; hyperthermia, filled circles; mean ± SEM). Top row, depolarizing threshold electrotonus (+40%; as in Fig. 2A). Middle row, hyperpolarizing threshold electrotonus (−40, −70 and −100%; as in Fig. 2B). Bottom row, recovery cycle.
