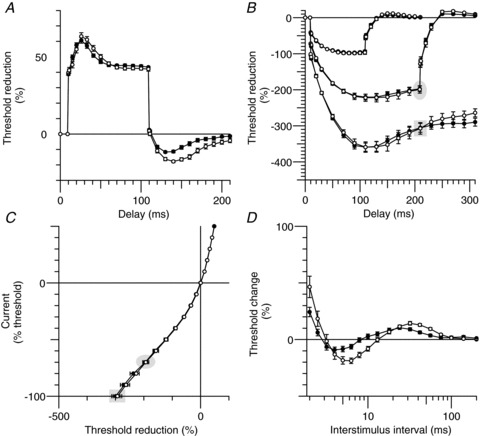
Figure 6. Sensory axon excitability during hyperthermia.

Group data (n= 6, mean ± SEM), open circles represent measures at normal temperatures and filled circles during hyperthermia. A, depolarizing threshold electrotonus with a conditioning current of +40% of the control stimulus. B, hyperpolarizing threshold electrotonus with currents −40, −70 and −100% of the control stimulus. C, current–threshold relationship tested at the end of 200 ms long conditioning currents (−100% to 50% of control threshold). D, recovery cycle after supramaximal stimulation. The corresponding data points in threshold electrotonus (B) and the current–threshold relationship (C) are highlighted by the shaded ellipses and rectangles for hyperpolarization by −70 and −100%, respectively.
