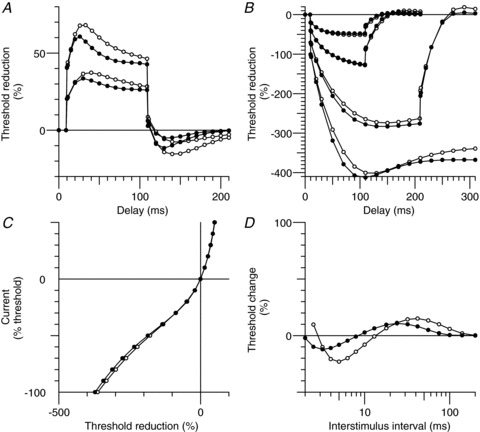
Figure 8. Mathematical model of the hyperthermia-induced changes in excitability of motor axons.

The open circles indicate the Bostock motor axon model at normal temperature, and the modelled changes during hyperthermia are shown as closed circles. Hyperthermia was modelled by an increase in temperature of 6°C (with the activation kinetics and maximum conductances increased according to their respective Q10 values; see the Methods section), a hyperpolarization of the half-activation voltage of Ih (11 mV) and a small additional depolarizing current at the internode of 20 pA. A, depolarizing threshold electrotonus for +40% and +20% of the control threshold. B, hyperpolarizing threshold electrotonus (−20%, −40%, −70% and −100%). C, current–threshold relationship. D, the recovery of excitability after a supramaximal stimulus.
