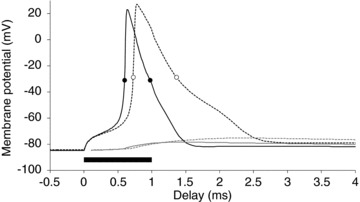
Figure 10. Modelled action potential during hyperthermia.

Nodal (black) and internodal (grey) membrane potentials during hyperthermia (continuous lines) and at normal temperature (dashed). Measurements of the half-maximal action potential width were made and are indicated by circles for hyperthermia (0.38 ms; filled) and normal temperature (0.64 ms; open). The filled bar depicts the stimulus duration.
