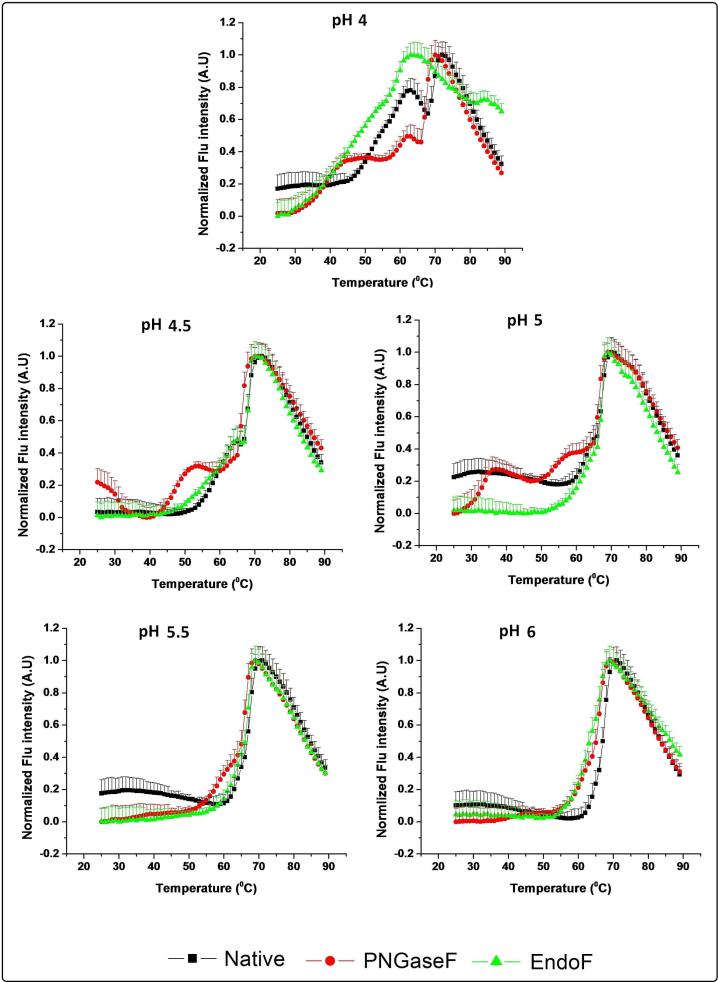
Figure 6.
Differential scanning fluorimetry (DSF) analysis of untreated (control) IgG1 (black line), the partially deglycosylated IgG (green line), and the fully deglycosylated IgG1 (red line) from pH 4 to 6. Normalized results were generated by fitting the data to be equal to 1 at the maxima and to 0 at the minima for incorporation into the EPDs and radar charts. Curves shown here are averages of three runs.

