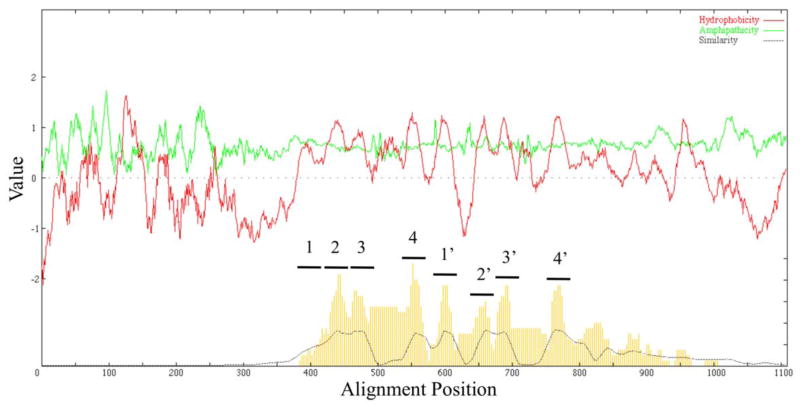
Figure 2. Average hydropathy, amphipathicity and similarity (AveHAS) plots based on a ClustalX multiple alignment.
All members of all TOG Superfamily families from TCDB were included except for the GPCR (see Fig. S10) family. The plot reveals 8 well conserved average TMSs. However, as many as 6 poorly conserved peaks of hydrophobicity can be seen representing additional potential TMSs in the non-homologous regions of some proteins.

