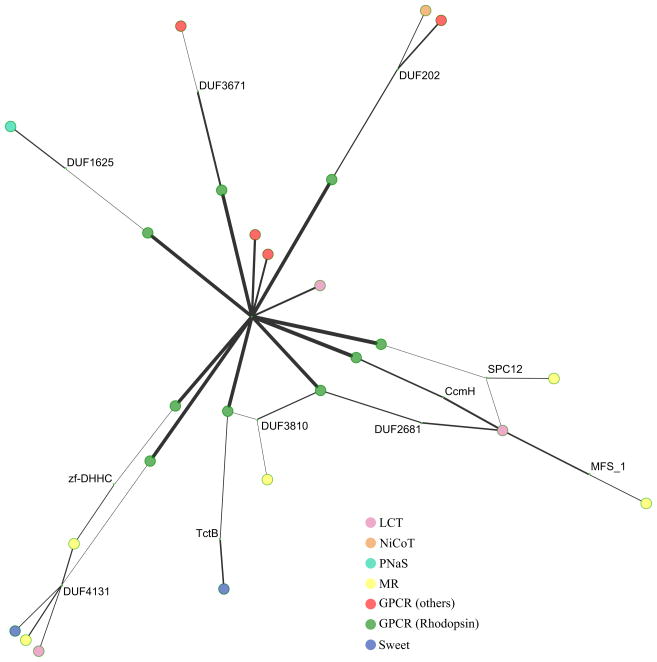
Figure 5. TOG superfamily constituent interrelationships revealed using Pfam.
Cytoscape (using Spring Embedded logic) visualization of our mapping of the proposed TOG superfamily to Pfam using HMMER3 and the default similarity cutoff (10). The Pfam nodes are shown in smaller size, and the edge width represents levels of similarity. The most significant link between any of the GPCR sequences and any of the non-GPCR sequences connects the central node of the Rhodopsin GPCR cluster (“7tm_1”) to an LCT sequence from A. thaliana (colored pink). The LCT sequences are similar to the Sweet sequences (colored violet) and overlap that cluster. The microbial rhodopsins (MR, colored yellow) show connectivity to the rhodopsin GPCR cluster.

