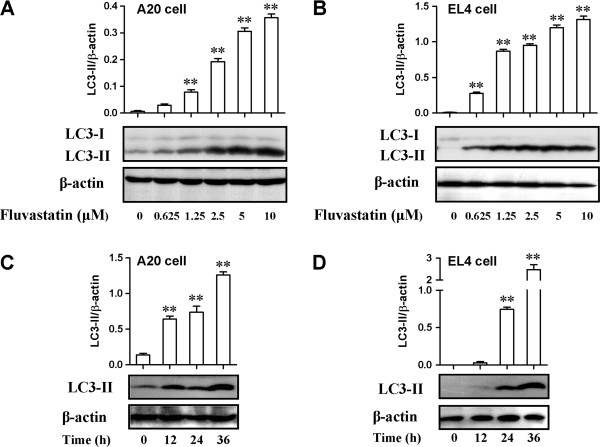
Figure 4.
Effects of fluvastatin on activation of autophagy-related molecules. (A and B) Lymphoma cells were incubated with fluvastatin (0–10 μM) for 24 h. Expression of LC3 in A20 cells (A) and EL4 cells (B) were examined by using Western blotting. Activation of autophagy was evaluated by the ratio of chemiluminescent signals between LC3-II and β-actin. Representative images were shown in lower panel. Up panel showed the ratio of chemiluminescent signals between LC3-II and β-actin. Data are presented as mean ± SEM of three separate experiments, **p < 0.01 versus resting cells. (C and D) Lymphoma cells were incubated with fluvastatin (2.5 μM) for indicated periods. Expression of LC3 in A20 cells (C) and EL4 cells (D) were examined by using Western blotting. Activation of autophagy was evaluated as described above. Representative images were shown in lower panel. Up panel showed the ratio of chemiluminescent signals between LC3-II and β-actin. Data are presented as mean ± SEM of three separate experiments, **p < 0.01 versus resting cells.

