
Figure 4.
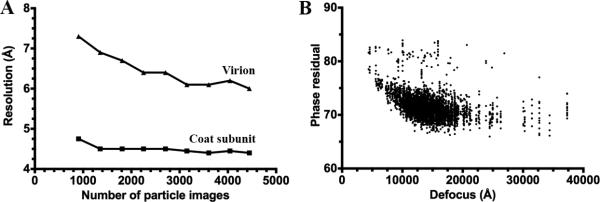
(A) Plot of the resolution of the reconstruction as a function of the number of particle images contributing to it. (B) Plot of the phase residual values output by Frealign for each particle image as a function of the estimated defocus for the micrograph from which it originates.