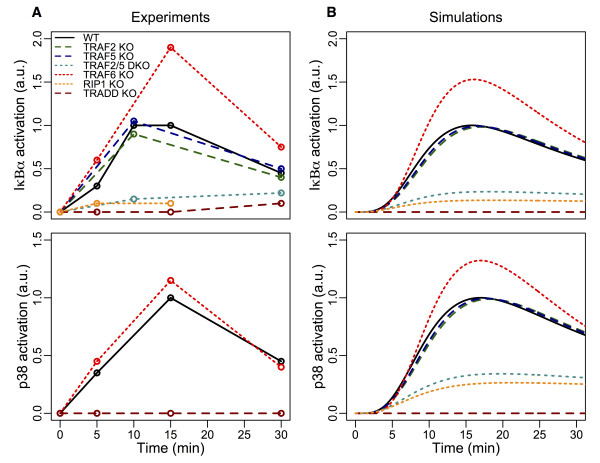
Figure 2.
Experimental and simulated profiles of IκBα and p38 activations in wildtype and mutant conditions. (A) Experimental profiles, MEFs were generally treated with 10 ng/mL of TNF, and (B) simulated profiles of IκBα (top panels) and p38 (bottom panels) activations up to 30 min in wildtype (WT), TRAF2 KO, TRAF5 KO, TRAF2/TRAF5 double KO (TRAF2/5 DKO), TRAF6 KO, TRADD KO and up to 15 min in RIP1 KO. Note: p38 experimental profiles are available only for WT, TRAF6 KO and TRADD KO. Experimental details and data are found in references [7,8,11,21]. ImageJ was used to estimate the intensities of the activation dynamics (Additional file 1: Table S1) for each molecule in each condition relative to wildtype peak activation values found in Additional file 1: Figure S2. IκBα phosphorylation refers to NF-κB activation throughout the text.

