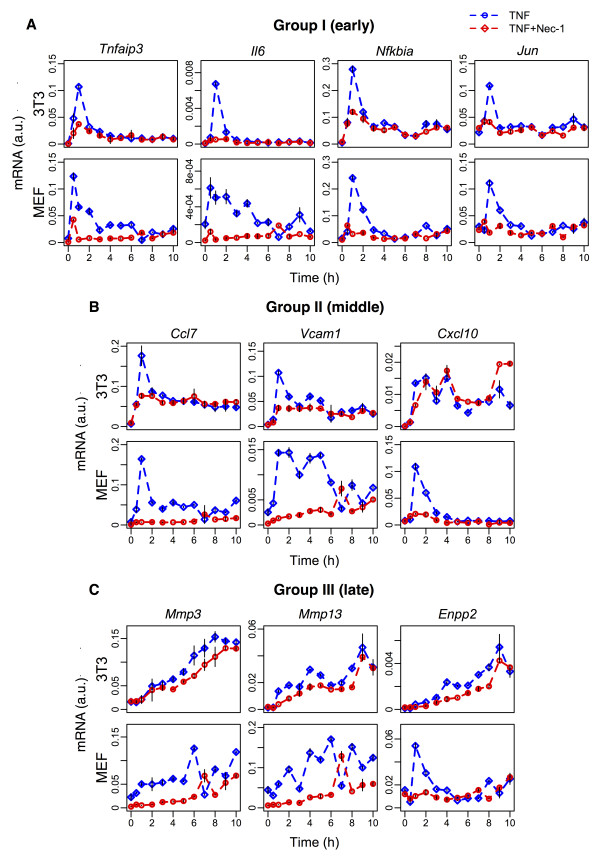
Figure 5.
Experimental verification of RIP1 inhibition through Nec-1. Temporal gene expressions of groups I (Tnfai3p, Il6, Jun, Nfkbia) (A), II (Ccl7, Vcam1, Cxcl10) (B), and III (Mmp3, Mmp13, Enpp2) (C) genes in 10 ng/mL of TNF-stimulated BALB/3T3 (top panels) and MEF (bottom) cells, treated without (blue curves) and with (red curves) Nec-1. Nec-1 treatment was applied for 30 min before TNF stimulation. Curves indicate average profiles relative to GAPDH gene expression for n = 3 independent experiments, and error bars show mean values ± SD.

