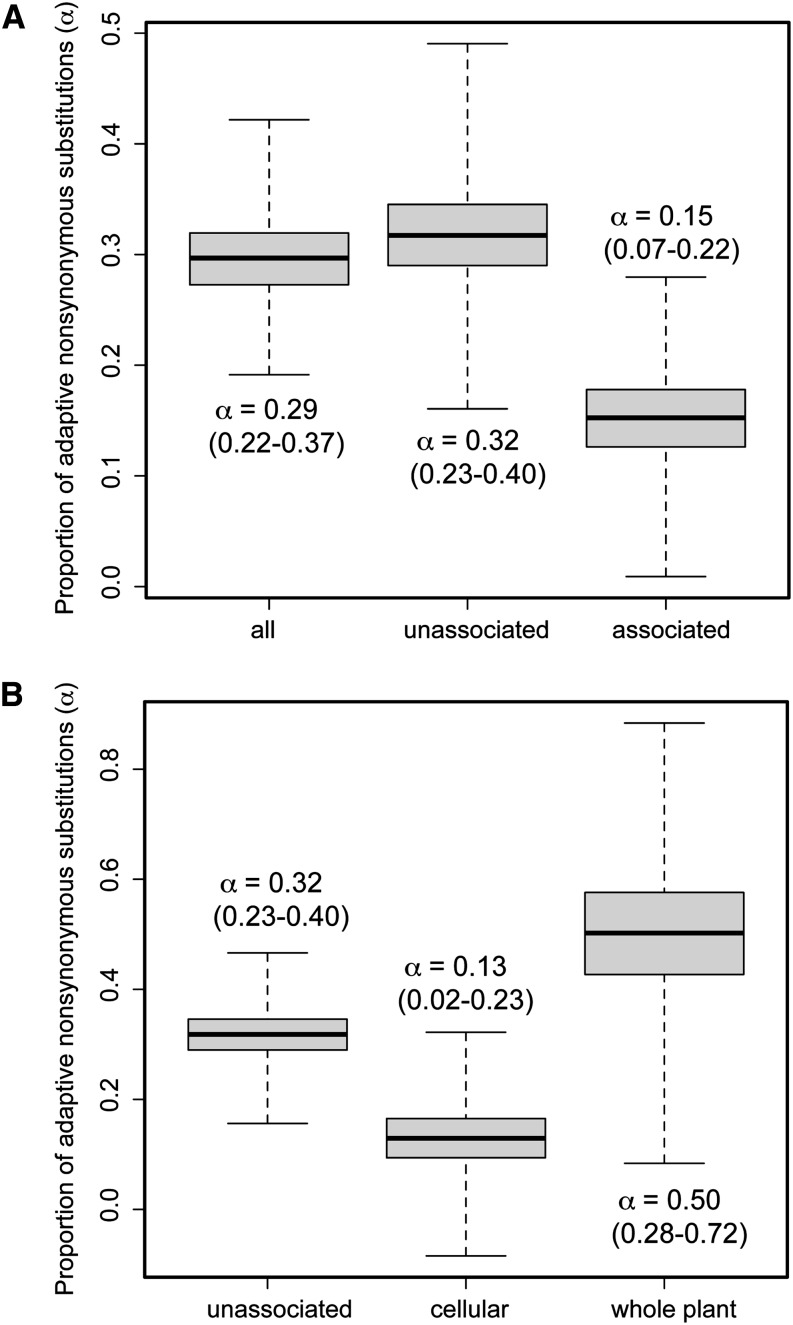
Figure 3.
The proportion of adaptive nonsynonymous substitutions (α) is significantly different from zero for the loblolly pine genome and varies across classes of amplicons. Numbers in parentheses give 95% bootstrap confidence intervals (n = 10,000 replicates) for α in both panels. (A) Whereas α is significantly larger than zero for all classes of amplicons, it is highest for the set of amplicons without associations to any of the phenotypes. (B) The patterns observed in A, however, are driven by amplicons associated to one of the cellular phenotypes (expression and metabolites), where the point estimate of α is 3.8 times lower than the point estimate for whole plant phenotypes (drought, disease, environmental associations).

