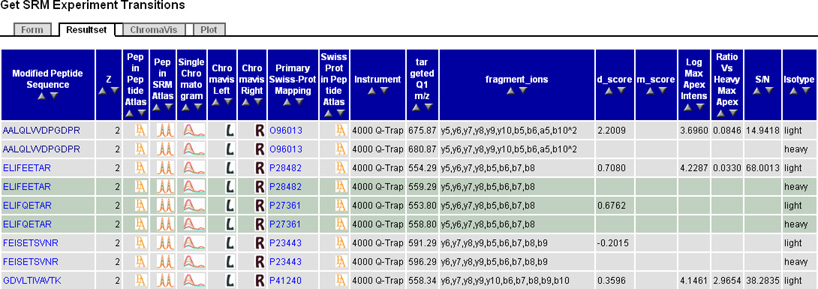
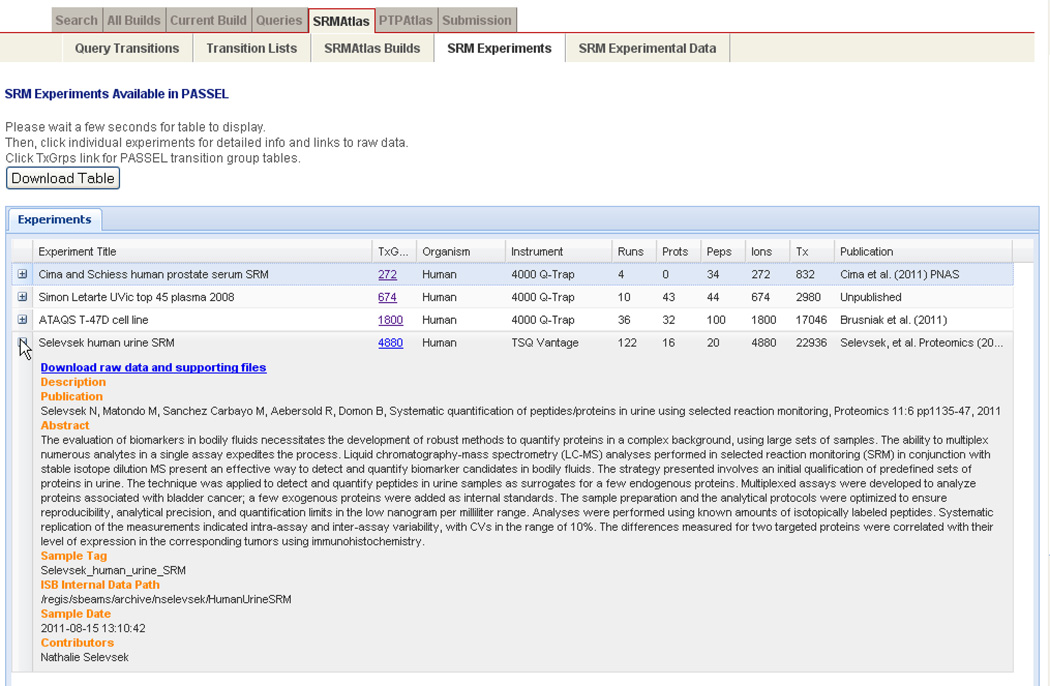
Figure 2.

(A) PASSEL experiment browser. Four publicly available experiments are shown, with the second entry expanded to show more details. Clicking the TxGrps hyperlink displays all of the transition groups for the experiment in the Transition Group Browser (Figure 2B).
(B) PASSEL transition group browser. Here, the user has selected to display all transition groups from a particular SRM run. Each row contains data for one measured transition group, including peptide sequence, charge, protein, instrument, m/z, fragment ions measured, quality scores, and quantitation metrics. Peptide sequences and protein names are hyperlinked so that one can obtain with a single click all results for a particular peptide or protein. Small icons provide links to PeptideAtlas, SRMAtlas best transitions, and the Chromavis chromatogram viewer. At the bottom of the page (not shown) are links for downloading the data into a spreadsheet.

