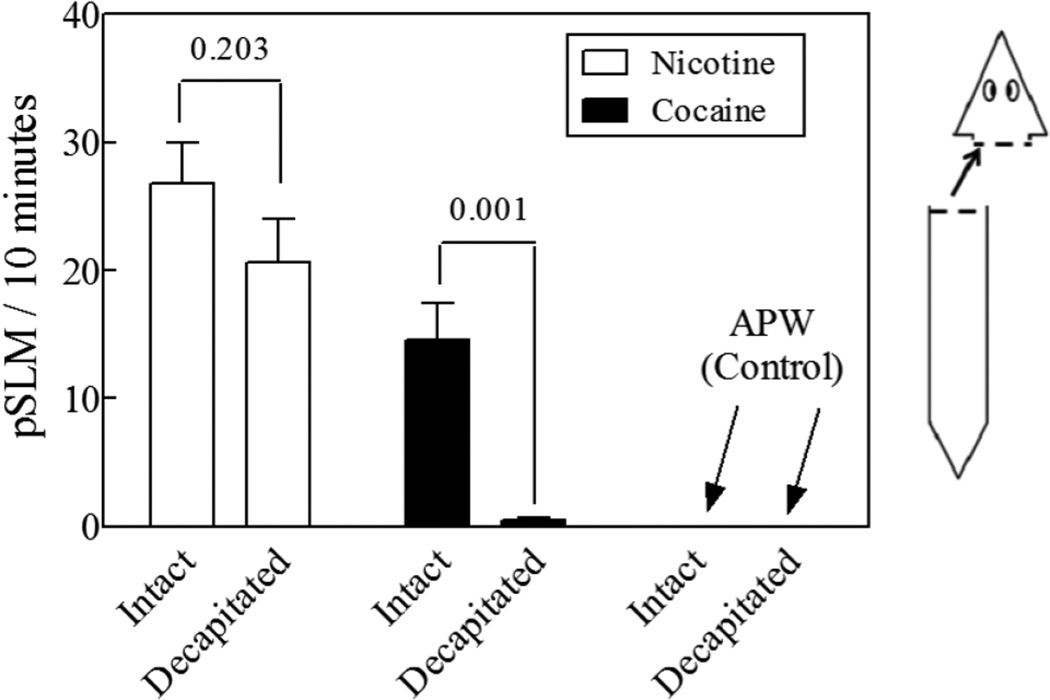
Figure 4.
pSLMs induced by 1 mM of the experimental compounds in intact and decapitated planarians (shown at right). N = 6–14 worms. The numbers in the figure indicate the p-value of the comparison of intact vs. decapitated planarians for each compound through an unpaired, two-tailed t-test. The error bars represent the standard error of the mean.

