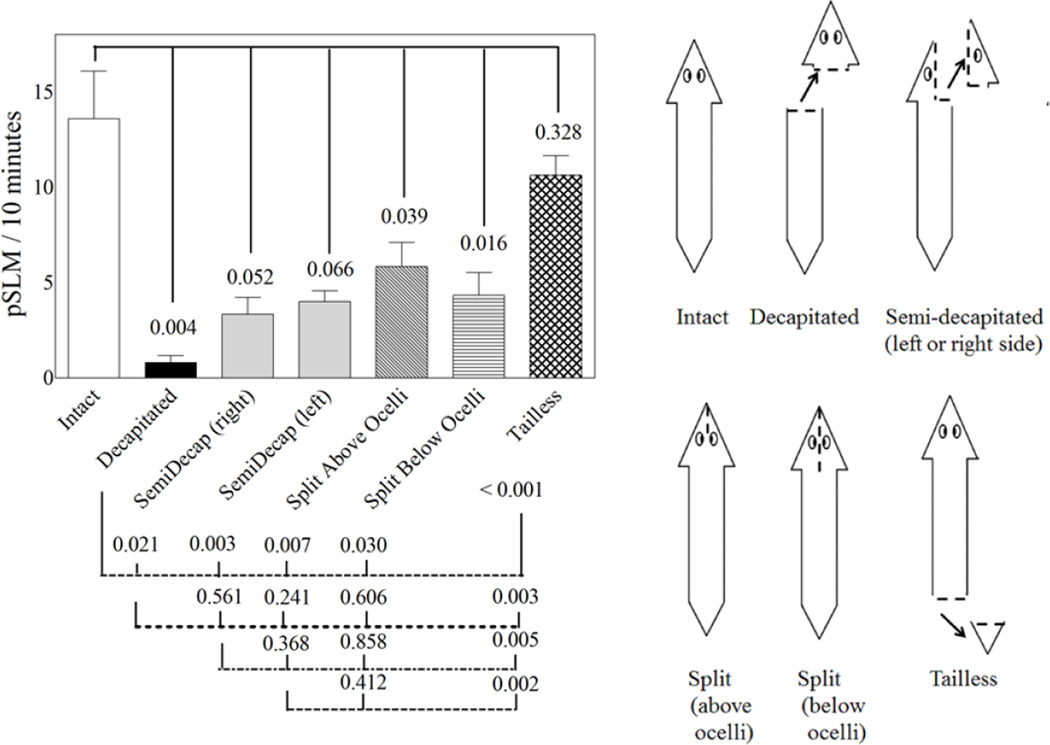
Figure 5.
pSLMs induced by 1 mM cocaine in intact, decapitated, semi-decapitated, head-split or tailless planarians as indicated in the drawing below the bar graph. The groups were compared by two-tailed unpaired t-tests. The numbers shown represent the p-values obtained from the comparison of the experimental groups. The error bars represent the standard error of the mean.

