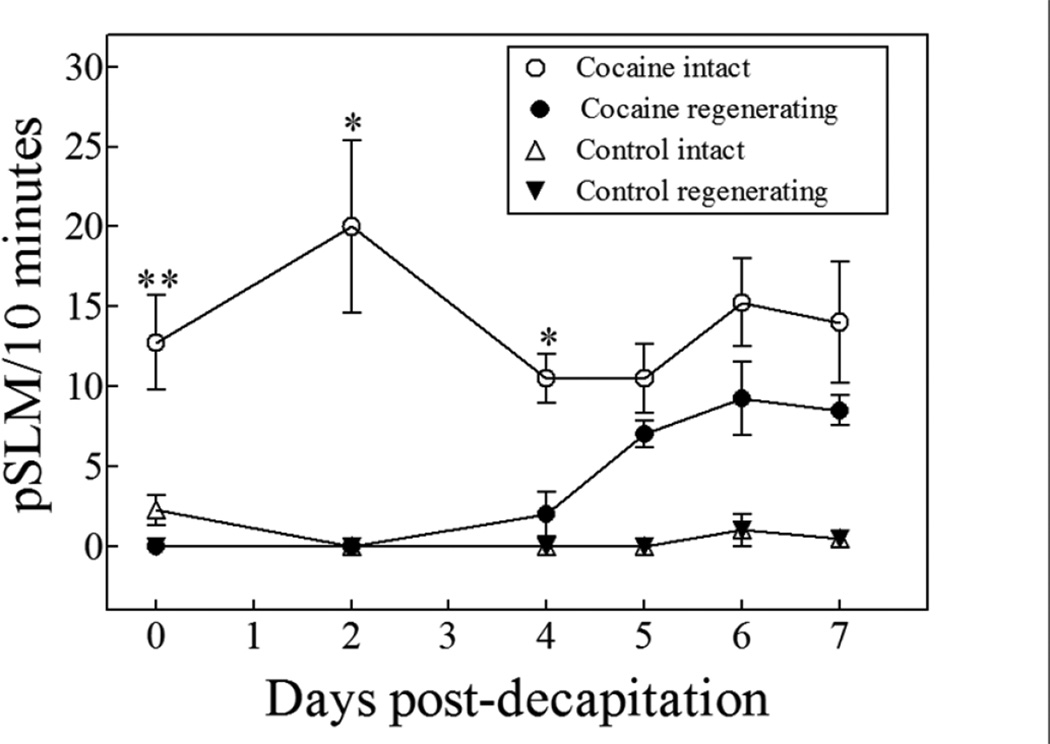
Figure 6.
Acute cocaine (1 mM) exposure to intact and regenerating planarians over a period of eight days; each symbol represent the average of ≥ 3 planarians. In brief, intact or regenerating planarians were exposed to cocaine on the day of decapitation (day 0) and discarded after the experiment. Each subsequent day, another set of planarians was experimented on and discarded, all the way to postdecapitation day 7 (See text and Figure 3). The regenerating planarians responded differently than the intact planarians to the exposure of cocaine (p < 0.0001, Two-way ANOVA). The comparison of intact vs. decapitated planarians for each day was done through a paired, two-tailed t-test (“*” ≤ 0.05; “**” ≤ 0.01; “***” ≤ 0.001). The error bars represent the standard error of the mean.

