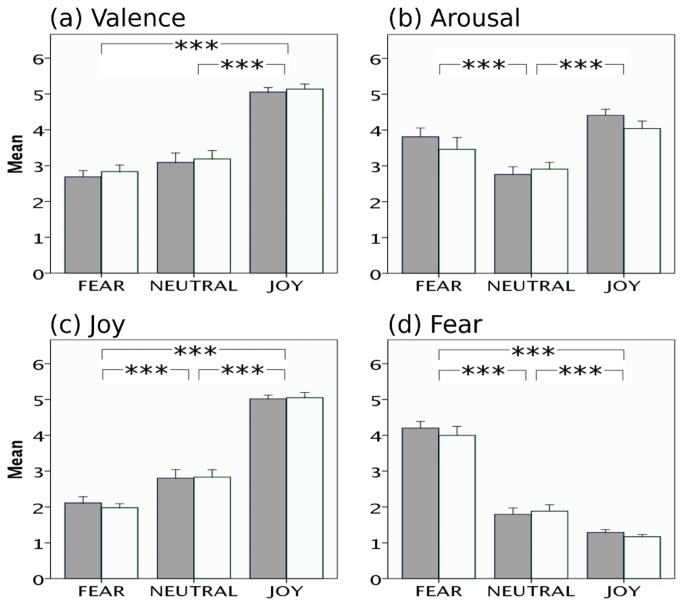
Figure 2. Behavioral ratings of participants on the four emotion scales used.
(a) valence, (b) arousal, (c) joy, and (d) fear. Ratings are depicted separately for each stimulus category (fear, neutral, joy). White bars represent the sparse scanning group and grey bars represent the continuous scanning group. Note that there were no significant differences in ratings between the two groups. Overall, joy stimuli were rated as more pleasant than fear and neutral ones (valence/pleasantness ratings of fear and neutral did not differ). Arousal ratings of joy and fear stimuli did not differ (and both joy and fear stimuli were rated as more arousing than neutral stimuli).

