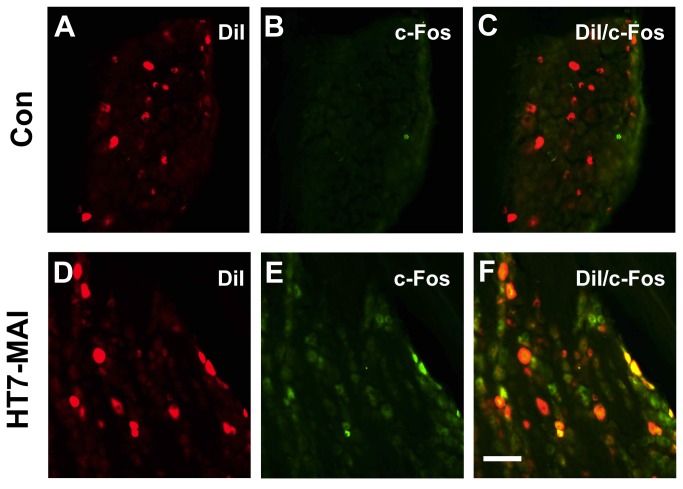
Figure 8. Enhanced c-Fos expression in DiI-labeled DRG neurons following HT7-MAI stimulation.
A-C: Immunofluorescent images of the expression of c-Fos (B) in DiI-labeled DRG neurons (A) from control group (no stimulation at HT7). D-F: The expression of c-Fos (E) in DiI-labeled DRG neurons (D) following MAI stimulation at HT7. The numbers of c-Fos positive cells were markedly increased (E) and double labeled cells of c-Fos/DiI were found in the DRG following HT7-MAI stimulation (F), whereas few c-Fos positive cells were seen in untreated DRGs (B). Bar=100 μm.

