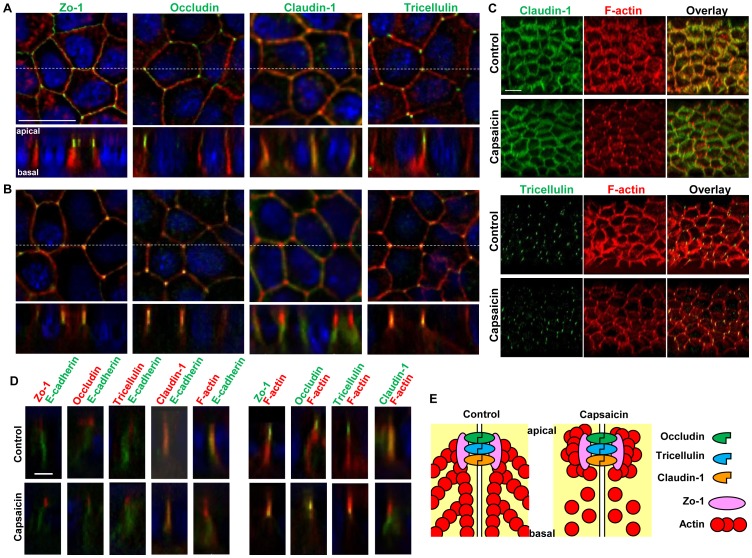
Figure 3. Effects of capsaicin on the distribution of TJ proteins and F-actin.
(A, B) Monolayers were exposed to vehicle (A) or 300 µM capsaicin (B) for 45 min and were labeled with each TJ antibody (green), rhodamine-phalloidin (red) and Hoechst (blue). Images were collected as a Z-series, and then deconvoluted and overlayed to display a single composite projection. Top: XY sections of merged images. Bottom: XZ sections of merged images. Scale bar: 10 µm. The corresponding TJ antibodies are listed above the images. (C) 3D projection images in a 45°-angle of claudin-1 and tricellulin staining, plus F-actin. Scale bar: 10 µm. (D) MDCK monolayers exposed to vehicle (top) or capsaicin (bottom) as above were stained with E-cadherin. The colors corresponding to each antibody are listed above the images. Scale bar: 2.5 µm. (E) Schematic explanation of the protein distributions.

