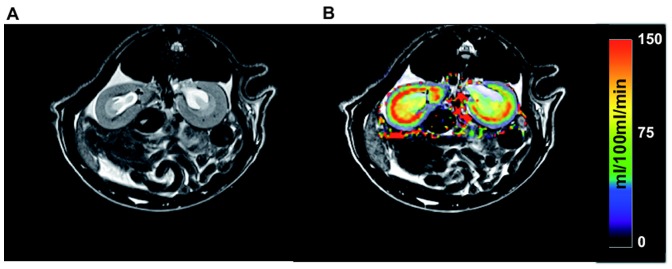
Figure 4. Image examples obtained by the MR measurements.

A) depicts one slice of a T2 weighted morphological MR image used for cortex delineation, B) shows a parametric map of the tubular flow (filtration) calculated from the DCE- MRI perfusion data in units of ml/min/100 ml tissue. The map is superimposed onto the corresponding slice of the T2 weighted image.
