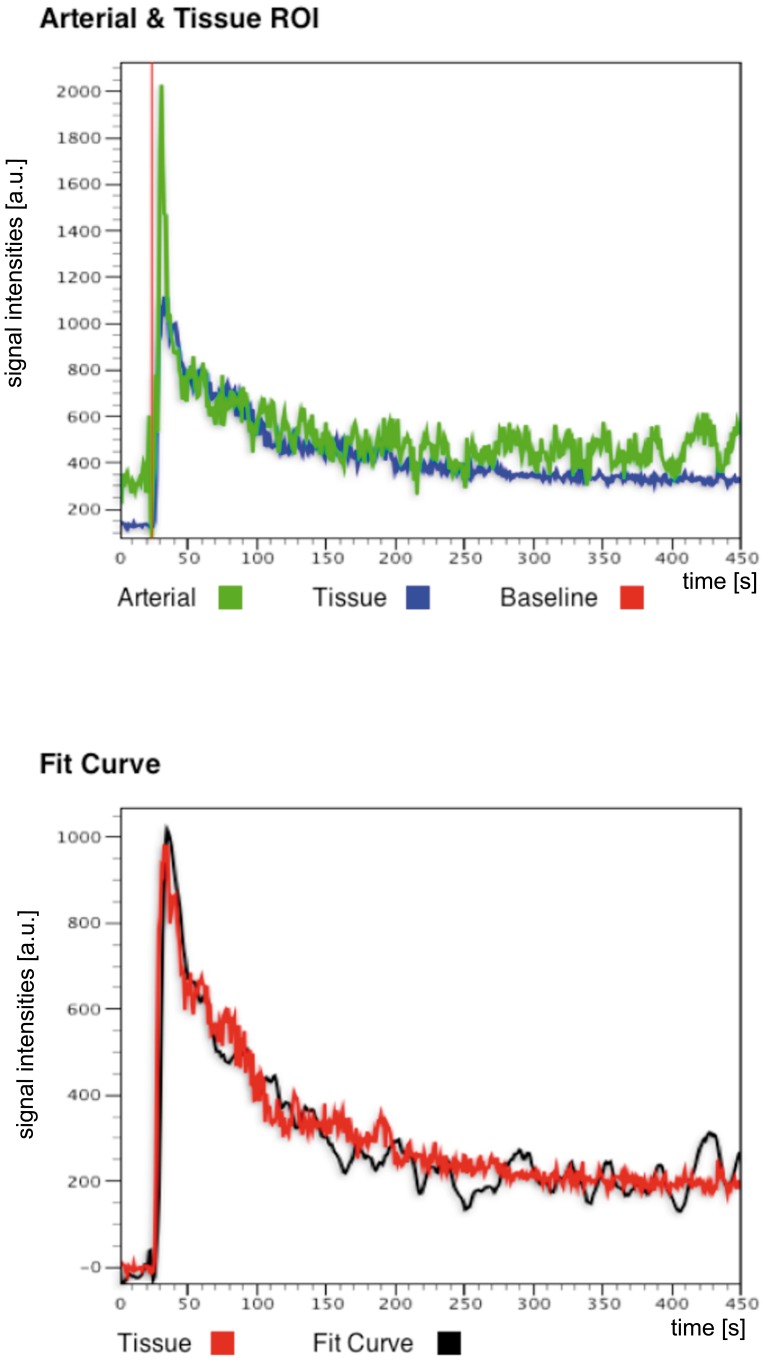
Figure 6. Example of fitting the 2CFM to a signal intensity curve.
The data was derived from a ROI in the cortex of the left kidney of a healthy SD rat. Top row: Tissue signal intensity curve of cortex ROI (blue) and AIF (green). Red line depicts base line selection for signal normalization. Lower row: corresponding fit of the 2CFM (black) to the tissue signal intensity curve (red).

