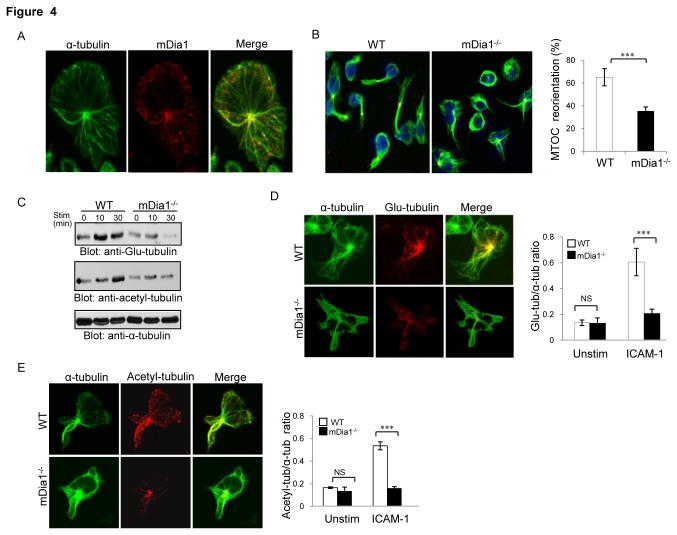
Figure 4. mDia1 regulates LFA-1-mediated T cell MT polarization and MT stabilization.
Ex-vivo derived wild-type or mDia1-/-T lymphoblasts were stimulated with ICAM-1 plus Mg2+/EGTA for 30 min followed by staining with fluorescently-labeled antibodies. (A) Representative immunofluorescence images showing the intracellular localization of mDia1 in ICAM-1-stimulated wild-type T cells stained with Cy3-labeled anti-mDia1 antibody and FITC- or Cy5-conjugated anti-α-tubulin antibody. (B) Left: MTOC reorientation in mDia1-/- and wild-type T cells stained with FITC-conjugated anti-α-tubulin and Cy3-conjugated anti-pericentrin antibodies. DAPI (blue) staining was used to show the nucleus. Right: MTOC reorientation was quantitated by determining the number of cells among 100 cells scored showing either no or aberrant MTOC reorientation. (C) WT or mDia1-/- T cells (5x10⁶) were stimulated with ICAM-1/Mg2+ (3μg/ml) or control IgG for the indicated times, lysed and the lysates then subjected to immunoblotting analysis with anti-Glu-tubulin or anti-acetyl-tubulin antibodies and reprobed with anti-α-tubulin antibody as loading control. (D & E) Left: WT or mDia1-/- T cells migrating on ICAM-1-coated plates were stained with anti-α-tubulin antibody and anti-Glu-tubulin antibody (D) or anti-acetyl-tubulin (E) antibody. Right: Calculation of the ratios of α-tubulin versus Glu-tubulin or acetyl-tubulin fluorescence intensities (analyzed using Image-Pro Plus 6.0 software). For all experiments, values shown represent means ±SEM and are representative of at least 4 independent experiments. ∗∗∗, p<0.001.

