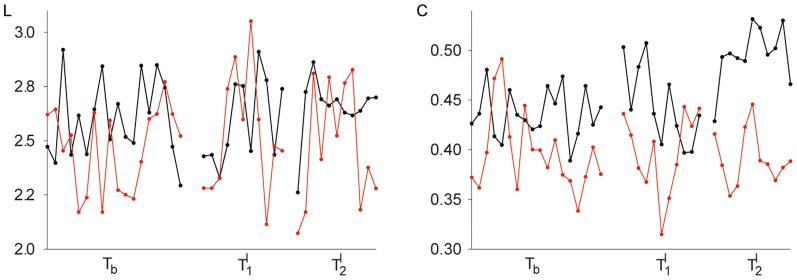
Figure 2. Exemplary temporal evolutions of global statistical network characteristics during different neuropsychological tasks.

Time courses of average shortest path length  (left) and clustering coefficient
  (right) from an epilepsy patient (red lines) and a control subject (black lines). Baseline recording (
 ); incidental learning task (
 ); intentional learning task (
 ). Lines are for eye-guidance only.
