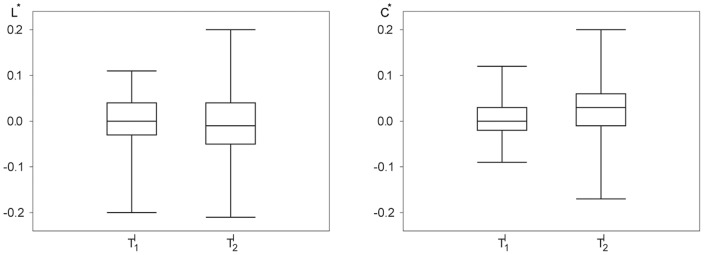
Figure 4. Comparison of the distributions of task-induced modifications of global statistical network characteristics.

Box-plots (see Figure 3 for details) of the relative deviation of the average shortest path length  (left) and of the clustering coefficient
  (right) during the learning tasks (
 and
and  ) from the respective values during the baseline recording
  .
.
