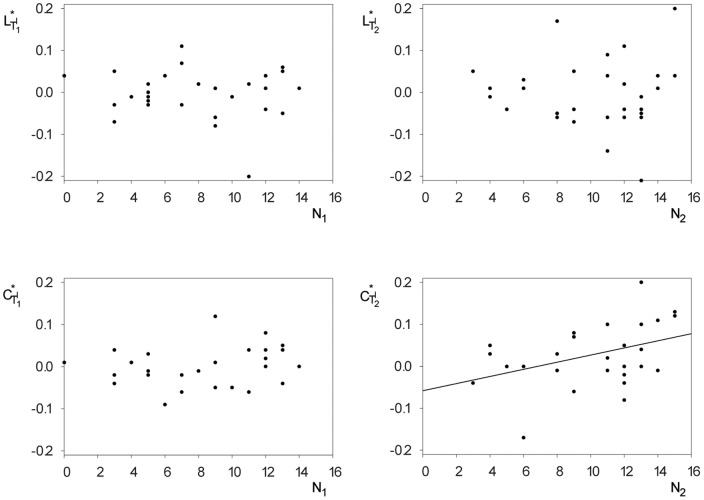
Figure 5. Relationships between task-induced modifications of global statistical network characteristics and recall performances.
Scatterplots of relative deviations of the average shortest path length  (top) and of the clustering coefficient
  (bottom) during incidental
  (left) and intentional learning
  (right) from the respective values during the baseline recording and subsequent recall performances
  and
and  . A significant correlation could only be observed between the relative clustering coefficient
  and the number
  of recalled words during
  (linear regression is represented with a solid black line).

