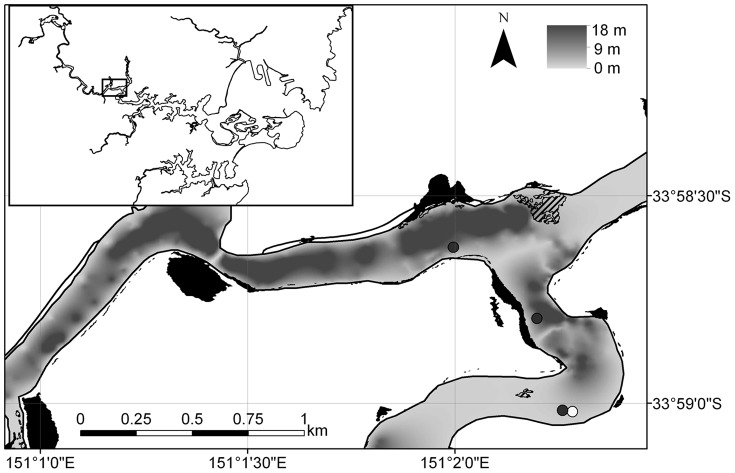
Figure 1. Map of the study area in the Georges River, southern Sydney, showing receiver locations (black circles), the Botany Bay Water Quality Improvement Program logger (white circle), Zostera sp. seagrass beds (hatched polygons), and mangroves (black polygons).
A bathymetry surface is also shown as a gradient between 0(shown in Figure legend in top right).

