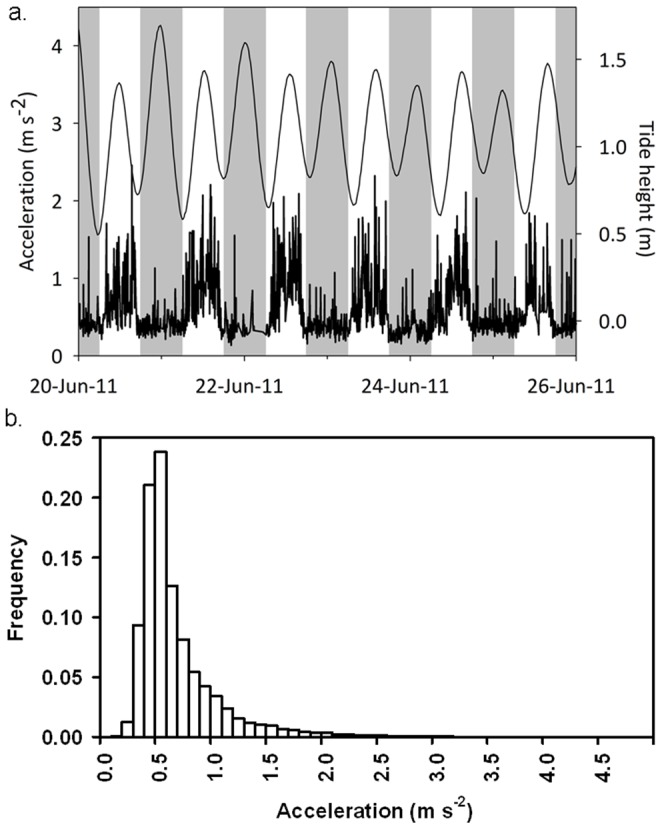
Figure 2. Actogram representative of fish activity (acceleration) across diel and tidal periods (a; data are for fish 3 in Table 1, between the dates 20th June 2011 and 26th June 2011), and frequency histogram of acceleration values measured in the study (b).

Tidal height (a; secondary y-axis) is represented by the solid black line, and grey shading indicates night and white shading indicates day.
