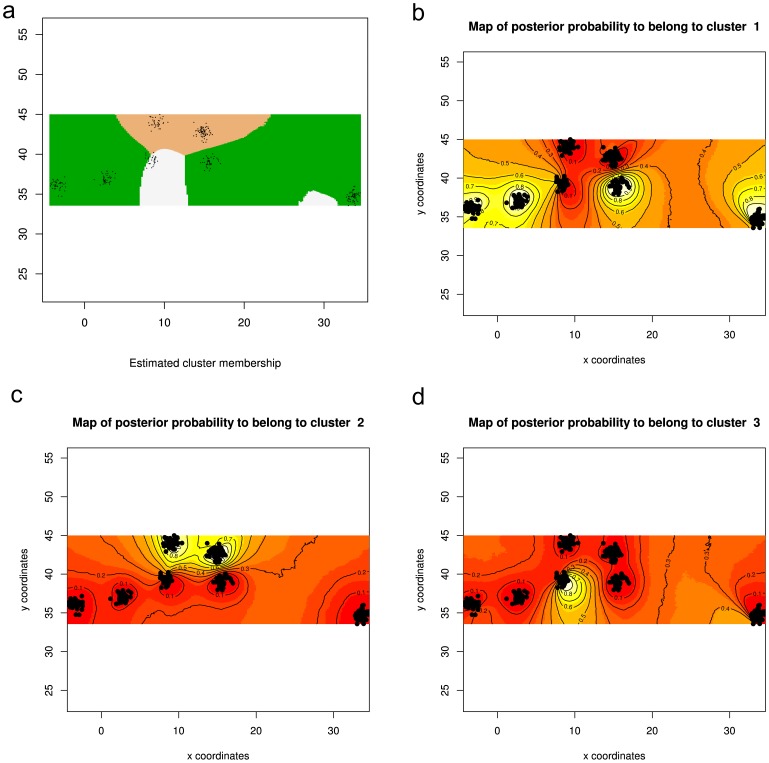
Figure 3. GENELAND results for K = 3 using the spatial model with correlated allele frequencies.
A) Map of estimated posterior probability of population membership (by posterior mode); B-D) plots representing the assignment of pixels to the southern (B), northern (C) and central cluster (D). The highest membership values are in light yellow and the contour lines indicate the spatial position of genetic discontinuities between populations.

