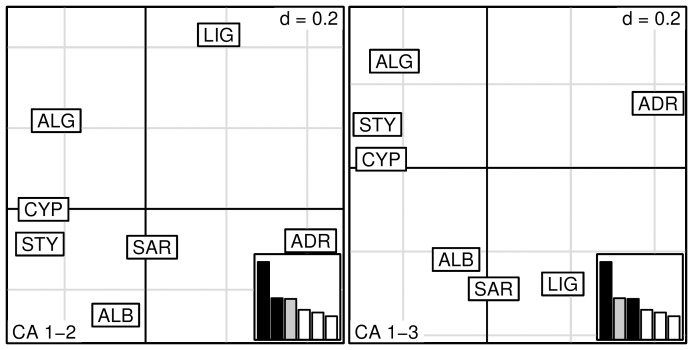
Figure 4. Correspondence Analysis plot of ABFT samples performed on population allele counts.
The eigenvalues barplots are drawn in the bottom right corner and black bars correspond to the two axes used in the biplot (on the left CA axis 1 vs 2, on the right CA axis 1 vs 3). Grey bars represent the axes considered in the analysis but not used to draw the graph.

