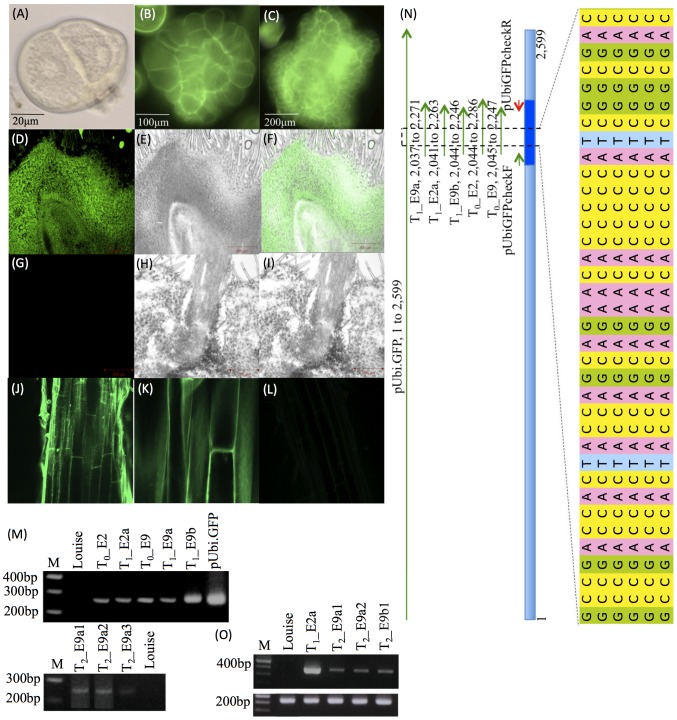
Figure 3. Cytological and molecular characterization of transformants with pUbi.GFP.
(A) An androgenic microspore of wheat cultivar Louise. (B and C) embryoid showing GFP expressing at T0. (D–F) Section of T1_E2a ovary showing GFP expression, left under GFP filter, middle white light and right an overlay of the two images. (G–I) Section of control ovary, left under GFP filter, middle white light and right an overlay of the two images. (J and K) Section of T2_E2a3 root showing GFP expression, left at 25× and right at 63×. (L) Section of control root visualized under GFP filter. (M) PCR based confirmation of transgene integration at T0, T1 and T2 generations using gene specific primer pair pUbiGFPcheck (see Table S3). M = 100 bp ladder. (N) Sequence based confirmation of transgene integration. In the line diagram, pUbi.GFP represents the vector sequence, pUbiGFPcheck F and R represent the primers used to amplify GFP gene from the wheat genomic DNA/plasmid DNA and T0_E2, T0_E9, T1_E2a, T1_E9a and T1_E9b represent the PCR products amplified from the genomic DNA of transformants and their progenies. A small part of the sequences was magnified to show integration of transgene in the wheat genome. (O) Confirmation of transgene expression by RT-PCR using T1 and T2 cDNAs amplified with gene-specific primer pairs GFPcheck F & R (Table S3) and Glyceraldehyde 3-phosphate dehydrogenase (GAPDH; used as control). [Note: The naming convention used to number transgenic events and their progeny is as follows. The first letter is to represent each regenerated plant. The number following this letter is to represent the tiller sampled from the regenerant. This number is followed by another letter that represents the T1 plant and the number succeeding this letter represents the T2 plant. Same naming system was followed throughout the manuscript.]

