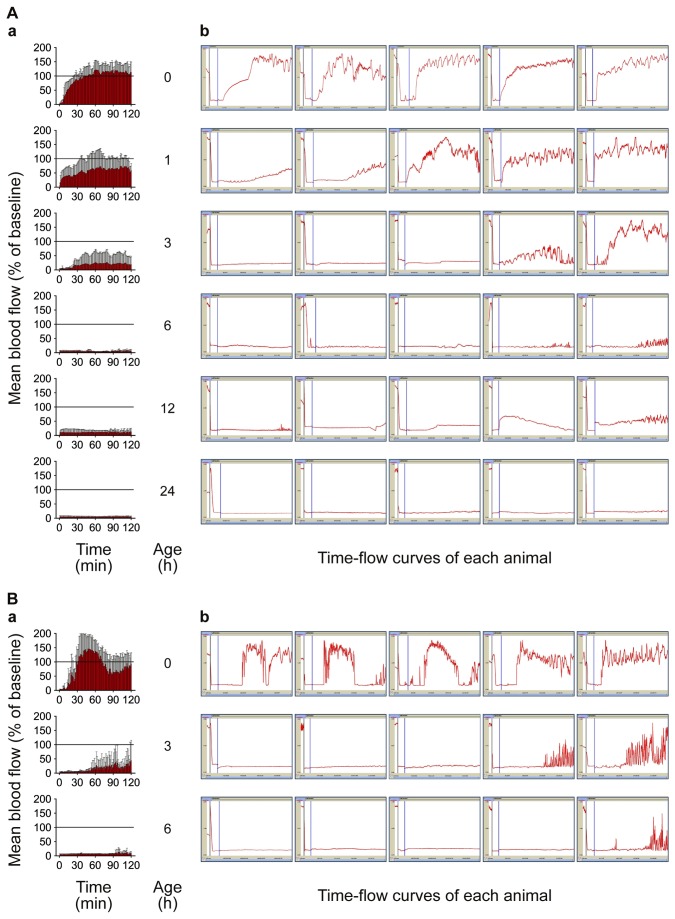
Figure 10. Thrombolytic effects of saxatilin (A) and rt-PA (B) on the aged thrombus.
a) Mean values of all animals in a group were calculated. Temporal changes are shown as continuous bar graphs (mean ± SD). b) Time-flow curves of all mice in each group. As the thrombus age increases, the thrombolytic effect decreases.

