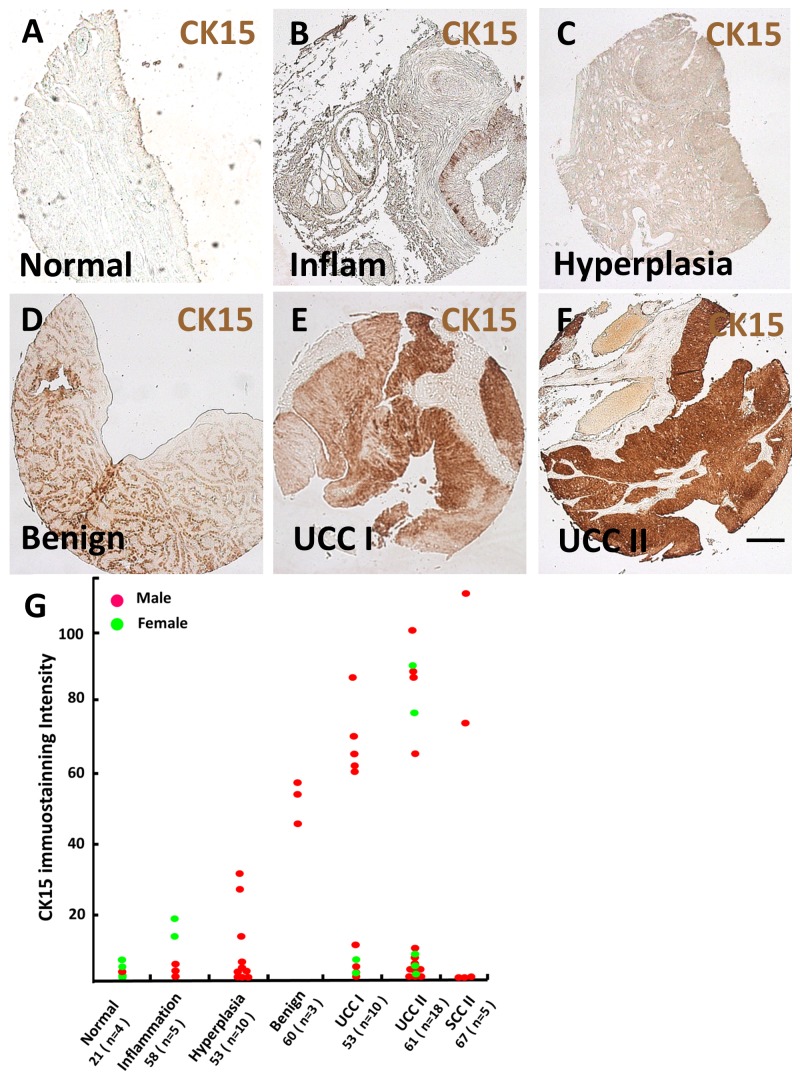
Figure 9. CK15 in human urinary bladder cancer.
A-F. Low power bright field images of histology from adult urinary bladders, from normal healthy (A) and pathological (B-F) tissues, as indicated in the frames (Inflam = inflamed tissue). G. Quantification (in arbitrary units) of CK15 immunohistochemical signals across urothelia and tumour sections of individual samples. On the horizontal axis, the first number below each group designation is the average age in years of the set of patients; the number of patient samples (n) is shown in brackets. SCC = squamous cell carcinoma of the bladder. Bar is 200 μm.

