
Figure 2. Effects of drought stress on lipid perxidation, electronlyte leakage, POD and CAT activity in the leaves of cotton cultivars J-13 and Lu-6.
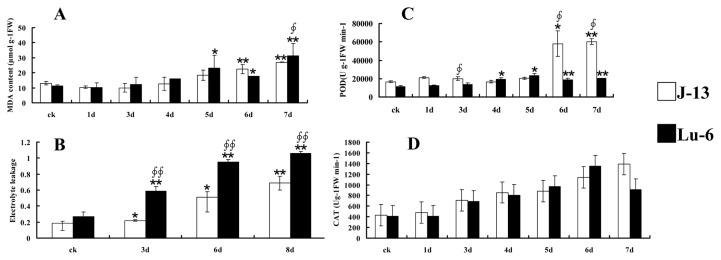
All the values are mean ±S.D. Independent t-tests demonstrated that there was significant (* p<0.05) or very significant (** p<0.01) difference between the drought-treated samples and controls, and there was significant (∮ p<0.05) or very significant (∮∮ p<0.01) difference between J-13 and Lu-6 at the same drought stress time point. Error bars were calculated from three independent experiments.