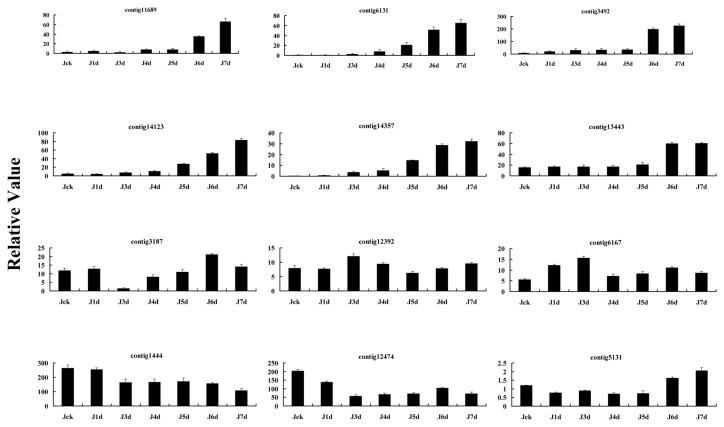
Figure 5. Expression profiles of the isolated genes in leaves of cotton J-13 seedlings under drought stress.
Relative expression levels were determined by real-time quantitative RT-PCR for data verification. Error bars represent the SD for three independent experiments, and three technical replicates were analyzed. Jck, J1d, J3d, J4d, J5d, J6d and J7d on the x-axis refer to cotton J-13 seedlings after withholding water for 0 (control), 1, 3, 4, 5, 6, and 7 days. The y-axis represents the relative expression level.

